Many people use Google Analytics, but only a few use it correctly. You probably won't become a Google Analytics Grandmaster overnight, but you can improve your Google Analytics skills. In the following, I will therefore present 7 Google Analytics features that can certainly help you with website analysis.
1. notes
The GA comment tool is basically a notepad that allows you to make notes about your account and your website. This saves you the trouble of having to cover your entire desk with post-it.
Basically, you write down here what you might otherwise forget in a hurry - changes, optimizations and much more. Because when working with a system as complex and enormous as GA, it's easy to lose track of things.
How to take notes with Google Analytics
You will find a small arrow underneath all graphs and reports from GA.

To make a note, simply click on the arrow that enlarges the graphic and then click on "Create new note".

Now all you have to do is write down your note. It's very simple - and yet you have an incredible number of possible uses.
2. individualization
Are you unhappy with the look of your dashboard? Then create your own. As there are many different templates to choose from, you don't have to stick with the default model. If you're the kind of person who likes to tweak and change their operating system, you'll be thrilled. Anyone who spends a lot of time with Google Analytics as well as taking care of many pages and analyzing a lot of data can make their life easier by optimizing some aspects.
How to change your dashboard
If you click on "Dashboards", you will be able to discover the default template as well as all the other templates that you have created yourself. You will also find the "New dashboard" option here. If you click on this, the following pop-up will appear:
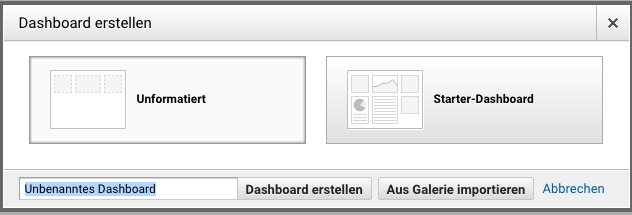
If you want to create a new dashboard from scratch, click on "Uniform". You don't need any HTML or design skills for this. Creating a new dashboard is nevertheless easier with starter dashboards, as templates appear there which can be edited according to your own ideas.
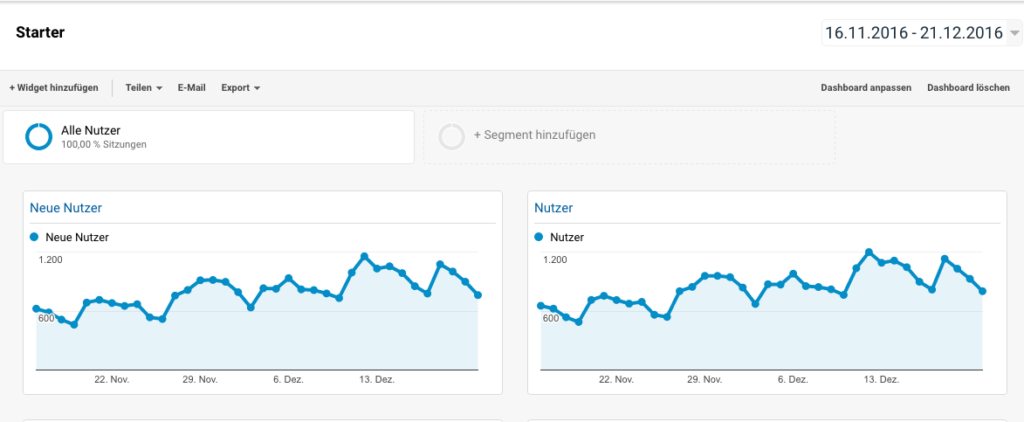
Under "Customize dashboard" you can now customize the layout of your dashboard according to your own ideas.
As you can see, the dashboard looks a little bleak and uninspiring at first. But this is where the widgets come into play: with the "Add widget" function, we can now add key figures and their development over time to our dashboard.
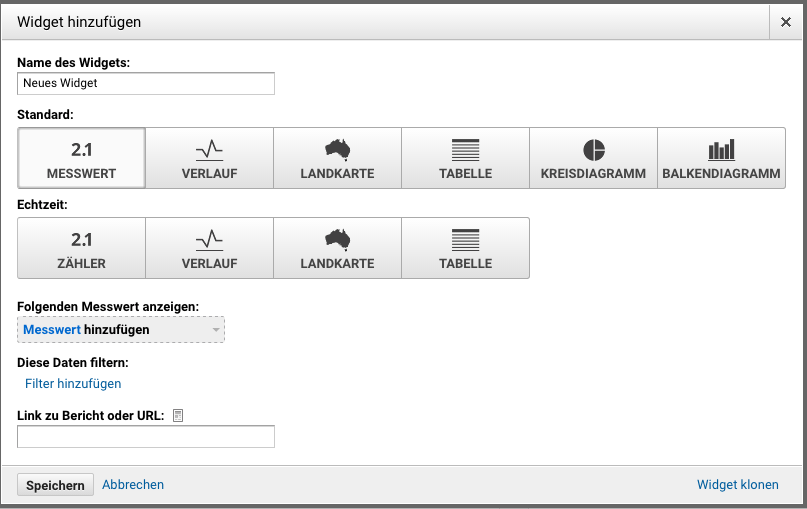
You can create up to 20 dashboards yourself at any time. You can use them to display the most important aspects that you need to monitor. You can also add as many widgets as you like to these dashboards. If you reach the limit, you can remove a dashboard and create a new one at any time.
Here are some examples of different dashboard widgets and customizations, all provided by Yoast (https://yoast.com/google-analytics-dashboards/)
3. user-defined NOTIFICATION for Google Analytics
You probably don't have the time to check Google Analytics every day. If you're anything like most website managers, you've probably spent a lot of time in Google Analytics for the first few weeks. At the beginning of a new project, many are so excited that they would initially prefer to monitor all changes and improvements and sometimes even watch users in real time. However, this changes over time and gradually it just becomes a chore.
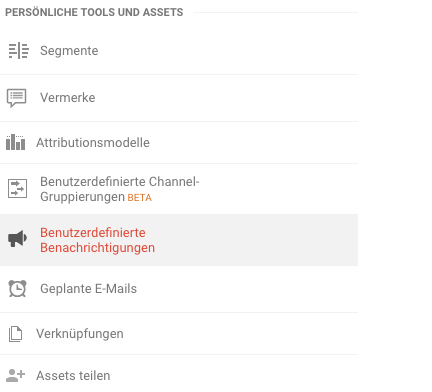
Fortunately, there is a way to make these processes easier for you. Under "custom notification", which you will find on the administrator's screen, you can instruct GA to send you a signal if, for example, access figures deteriorate.
You may want to be alerted if your traffic drops suddenly or if you have a sudden and rapid increase in visitors from a particular country. Whatever you choose, Google Analytics will notify you in real time via email or SMS.
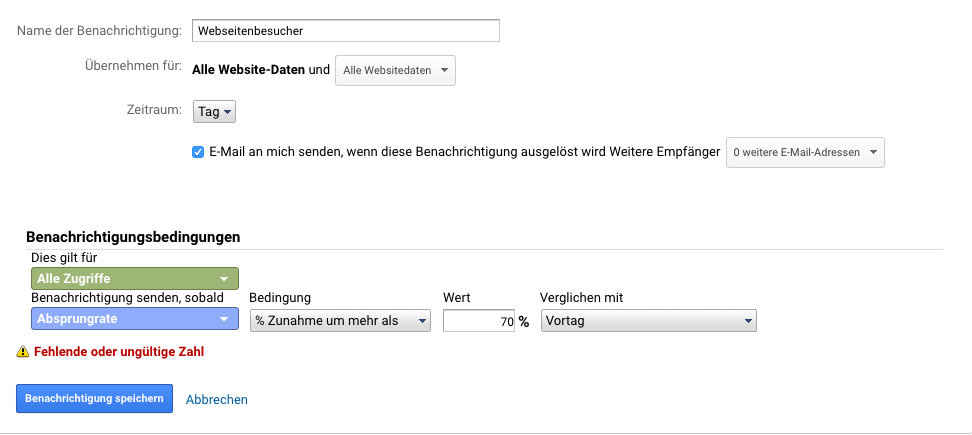
In the following example, you can see a notification that notifies me by e-mail if the bounce rate increases by more than 70% compared to the previous day.
4. setting target projects for Google Analytics
Depending on your website, you will have certain goals. Maybe you want to increase the number of visitors to your site to reach more customers for your product? Or maybe you want to attract more potential customers and close partnerships? Whatever your goal, Google Analytics has built-in goal tracking statistics to help you monitor your goals and let you know when you've achieved them.
To set up a target, click on "Manage" in the data view column and you will find the "Target project" tab.
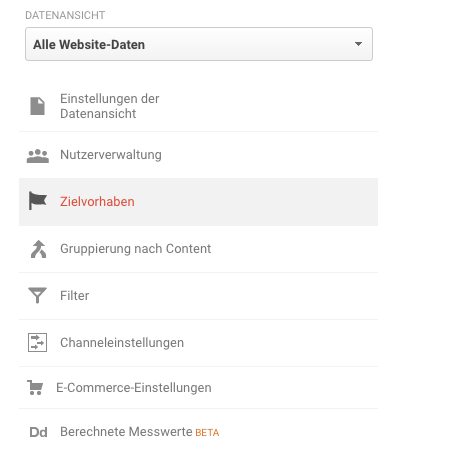
You will now find the "New target project" option in the top left-hand corner. We select this to create a new target project. As you can see in the example, I have already predefined two target projects. In total, you can create up to 20 target projects in your data view.

From here, you can set numerous different goals. This is a process that consists of 3 steps.
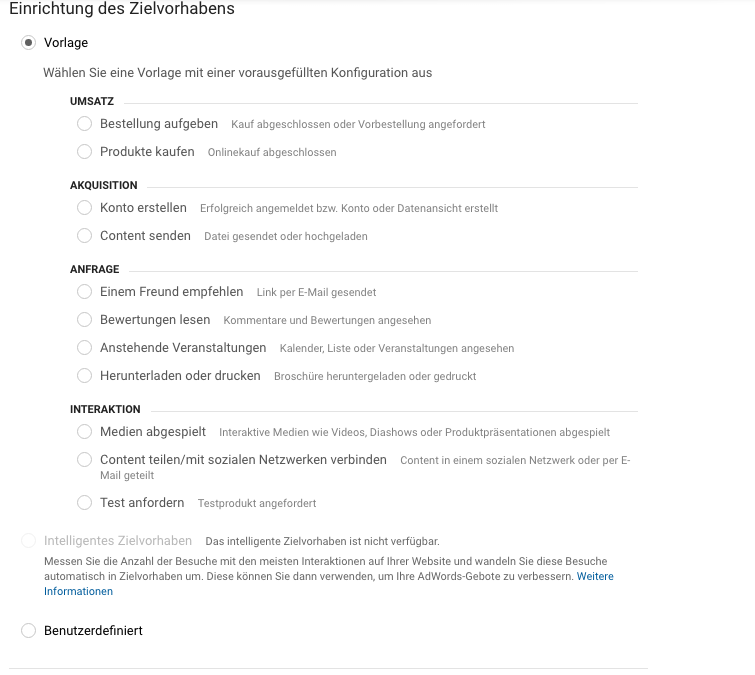
Step 1: Setting up the target project
These are self-explanatory and most of them are actually covered here. If your goal is still not available, select the custom option at the bottom of the page and then click on "Continue". In my example, I'll show you how we set up the payment process in my online store as a target project.
Step 2: Target description
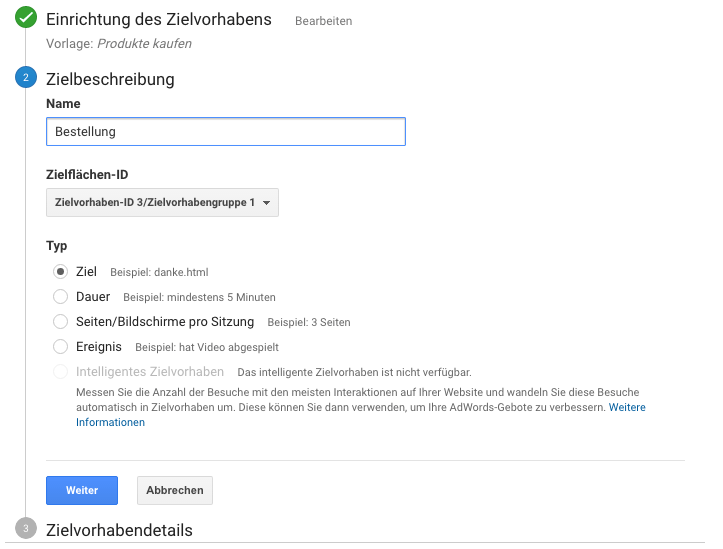
The second step is to define the actual goal. Now you define a name for your target project, the type of target (dwell time, page views per session, an event, or access to a specific page). An order in our online store is only successfully completed when the customer reaches the "Order confirmation" page. For this reason, I select the option "Destination" example danke.html.
3. target plan details
The 3rd and final step is to add the final details to the goal. You can decide whether to add a monetary value to your goal (if it has one) or a "funnel" that defines the user's path. To be able to measure the conversion, I add the URL of the order confirmation page under "Goal is the same".
To test the goal, click on the "Goal confirmation" option at the bottom of the page. Now GA compares these parameters with the associated and collected data and informs you how often the goal was achieved in the last week.

5. do not track certain IP addresses
Since it's your own website, you're certainly spending a lot of time uploading new content, running checks and seeing if everything is in order. Especially if you're just starting out, your website is in a niche or you're doing a lot of reviews, this data can skew your overall stats.
To ensure that certain IP addresses are not included, we need to create a filter. To do this, we go to "Administration" and select "Filter" in the data view.
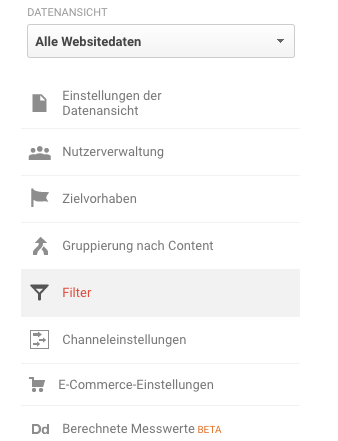
We then select Add filter, to be able to create a filter.
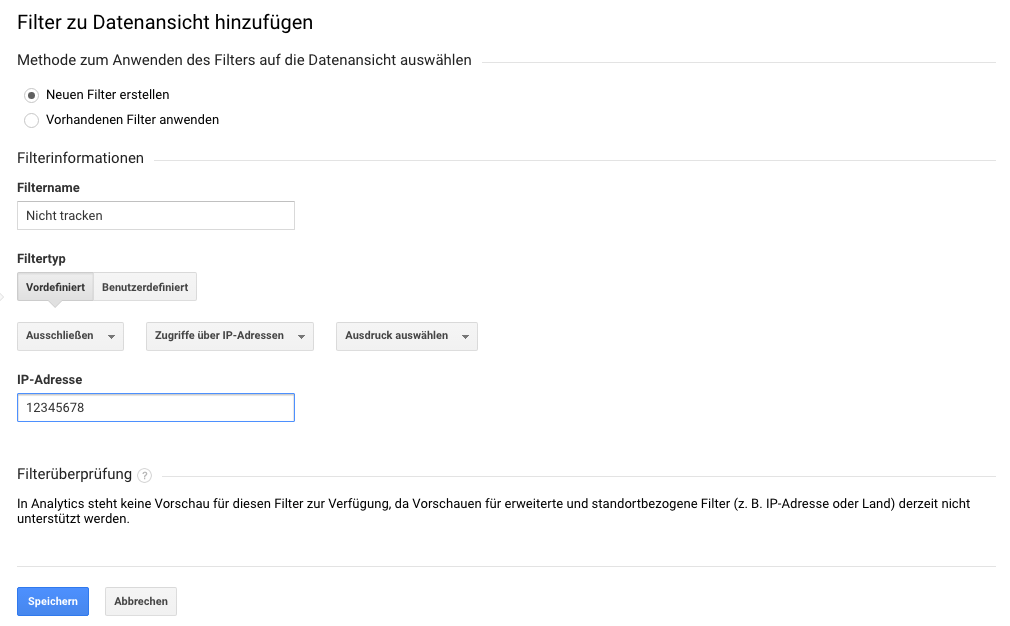
However, instead of setting a "customized filter", click on "predefined filter". Here you only need to specify that GA should ignore all traffic from your IP address. After we have selected the predefined filter, we select "Exclude", "Access via IP addresses" and "Are equal" in the three drop-down fields. A field should now open in which we can exclude our IP address. Of course, you can also exclude multiple IP addresses.
This filter can also be used to block traffic from host names, subdomains or even from a block of IP addresses and visitors from a specific region.
 6. display individual lines
The "Channels" report is one of the most frequently used reports in Google Analytics. Basically, all sessions are summarized in the graphic.
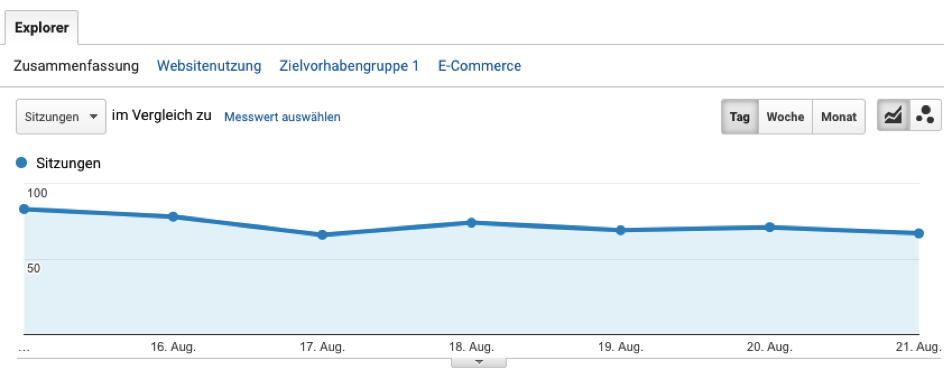
In addition to the conventional graphic, which summarizes all traffic channels, the different channels can also be displayed in the graphic. With the selection option next to the respective channel summary and the "Show lines" setting, the history for the selected channels can be displayed.
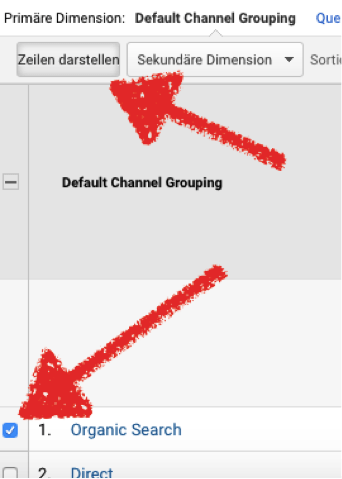
There is no restriction on which channels you can display. This feature allows us to analyze the traffic history across multiple channels in a specific time window. The graphical display in particular makes it much easier to analyze.

7.user-defined channel grouping
With the custom channel grouping function, we can define our own acquisition channels. This is particularly useful as the standard channels "Organic, Email, Social, Paid etc." are too generic to perform a clear & efficient analysis.
To use the user-defined channel groupings, we switch back to the administration and select the "User-defined channel groupings" option in the data view.
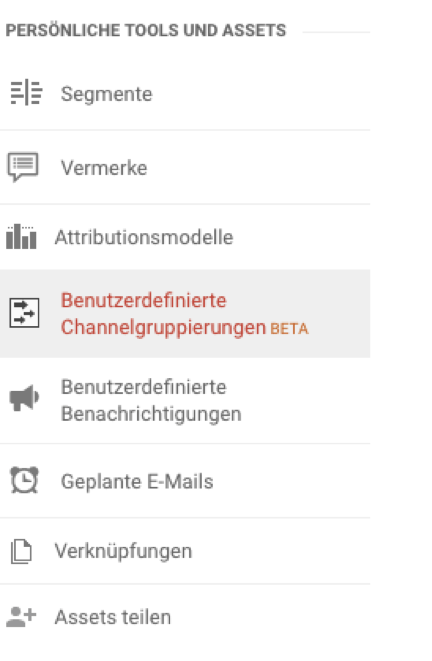
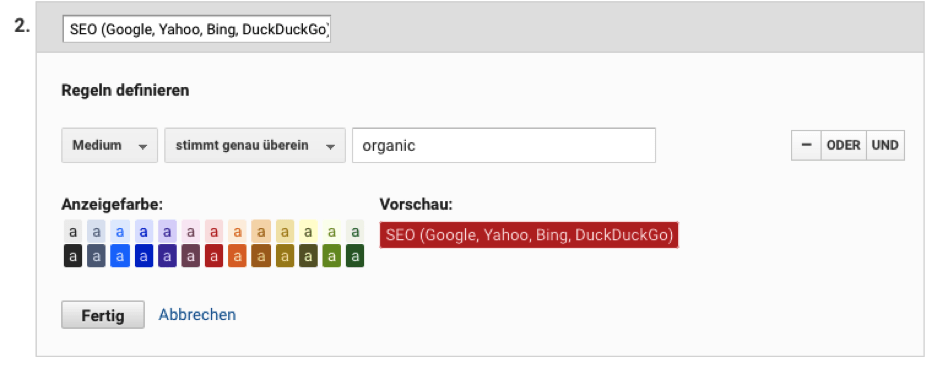
Since the website to be analyzed gains the majority of its visitors via organic search, I now create a channel that combines all organic search engine hits (Google, Yahoo, Bing, DuckDuckGo). The following steps must be observed:
- First we need to give the channel grouping a name.
- Now it's all about the channel definition
- Now we need to create rules to summarize the different sources. To do this, we select "Medium", "matches exactly" & "organic" button. Now we can save the grouping.
Now we can find the user-defined channel grouping in the channel reports under Default Channel Grouping.

Now the user-defined groupings are displayed as specified. In particular, the organic search as well as the traffic via Facebook can be displayed much better.
I hope you enjoyed my contribution on the topic: "7 Google Analytics features you should know" and can help you analyze your website visitors.
7 Google Analytics features you should know - YouTube video tutorial


